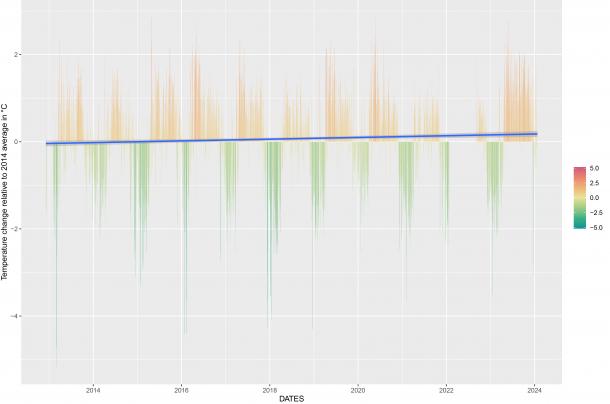
March is always one of the hottest months of the year in Guanacaste, but this year is one for the record books. The combination of the El Niño phenomenon and the absence of clouds and trade winds resulted in temperatures close to 40 degrees Celsius (104 degrees Fahrenheit) during the day. February of this year was recorded as the warmest month globally in modern times. And, while El Niño is contributing to this warmth, human-caused climate change is the primary driver. In ACG, GDFCF Board Member and Associate Professor in the Department of Integrative Biology at the University of Guelph, Canada, Dr. Alex Smith, has been studying the impacts of climate change on insects. As part of his research, Alex has been taking precipitation and temperature measurements at his eight ACG study sites since 2013. The graph above is illustrative of the impact of climate change in the tropics. It “tells the story best,” according to Alex. Taken at the top of Volcán Cacao, the graph shows the steady increase (blue line) in average temperature realative to the 2014 average over time. The graph below shows the departure from early average temperature in this cloud forest over time. The temperature here should show very little variation – it should be consistently wet and cool. But, as seen in the graph, the bar is getting darker red over time as the average temperature is exceeded more frequently. This site is warming. “These cloud forests,” says Alex, “are drying. And as they do, the thousands of species that call this restricted site their home have nowhere cooler or wetter where they can escape to.” The daily temperature has been slowly increasing and the hottest part of the day is happening earlier – both in the air and the soil – and these phenomena are most pronounced at the higher elevations. Climate change, says Alex, “sounds like leaves crunching under my boots... I mourn for the species with no higher place to climb on these sleeping volcanoes.”
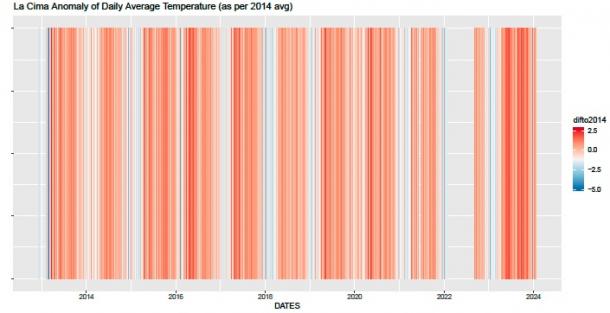
To come up with this graph, Dr. Alex Smith took the average temperature for an "early" year when he began recording air temperature (in this case, 2014) and then, for each day, calculated the difference between that daily average temperature and the 2014 average. The color bars show the seasonality quite clearly, and the increased warmth evident in 2023/4. These numbers are from the study site at the peak of Volcán Cacao.